Water quality
Harbour and River Water Quality
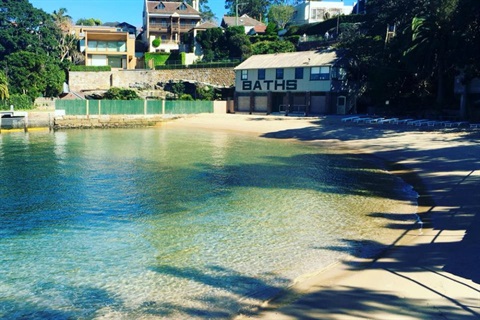
NSW Beachwatch monitors and reports recreational water quality at swimming sites in the Sydney region and provides daily pollution forecasts and weekly star ratings for each monitored swimming site. This includes information about water quality at swimming locations in the lower Lane Cove River such as Greenwich Baths and Woolwich Baths.
For a longer term assessment of the water quality of swimming spots in the harbour and beaches across Sydney and NSW, view the latest State of the Beaches Report 2022-2023.
If it has rained during the last few days, the water may be polluted by stormwater runoff and it is recommended that you avoid swimming during and at least one day after heavy rain at ocean beaches, and for up to three days at estuarine swimming areas.
Water Quality Monitoring Programs

StreamWatch
StreamWatch is a long running volunteer water monitoring program with 170 volunteers across the Sydney, Blue Mountains and Illawarra region. Starting in 1990, StreamWatch began with a trial in 15 schools and a focus on curriculum implementation in secondary schools, but quickly extended beyond schools into a citizen science program. There is currently one active StreamWatch group in Lane Cove.
Stringybark Creek StreamWatch Group
Meets on the 1st Saturday of every month from 9:00am - 11:00am.
To join StreamWatch, please contact the Bushcare Co-ordinator on 9911 3579 or email bushcare@lanecove.nsw.gov.au
StreamWatch groups test a range of water qualities including, but not limited to; turbidity, electrical conductivity, pH and temperature. These measurements paint a picture of the health of our creeks and catchment.
Turbidity measures the cloudiness of water caused by tiny particles. High turbidity reduces the growth of aquatic plants which affects the animals that rely on these plants. It also makes it difficult for animals to breathe by clogging their gills. Turbidity is caused by soil erosion due to heavy rainfall or floods and sediments from building sites amongst other causes.
Electrical conductivity is used as an indirect measure of salinity. The greater the concentration of salt in water, the better it conducts electricity. Large and rapid changes in salinity are usually the result of human activities such as industrial discharge and sewage discharge.
pH measures the acidity and alkalinity of the water. Most aquatic organisms are adapted to living within narrow pH ranges around neutral. The optimal pH range for most Australian freshwater organisms is from 6.5 to 8.0. If the pH remains outside the optimal range, aquatic organisms will become stressed and it can cause a decrease in the number of species living in a waterway.
Water temperature is the major factor determining how much dissolved oxygen there is in water. Cold water is able to hold more dissolved oxygen than warm water, and dissolved oxygen is essential for the survival of aquatic animals.
For more information about StreamWatch, visit Greater Sydney Landcare Network.
National Waterbug Blitz
The National Waterbug Blitz is a nation-wide Citizen Science program encouraging participants to investigate how healthy their local waterways and wetlands are. The type and number of waterbugs found in a waterway can tell us a lot about how healthy that waterway is. Council supports the National Waterbug Blitz through hosting regular Let's go Bug Hunting activities.